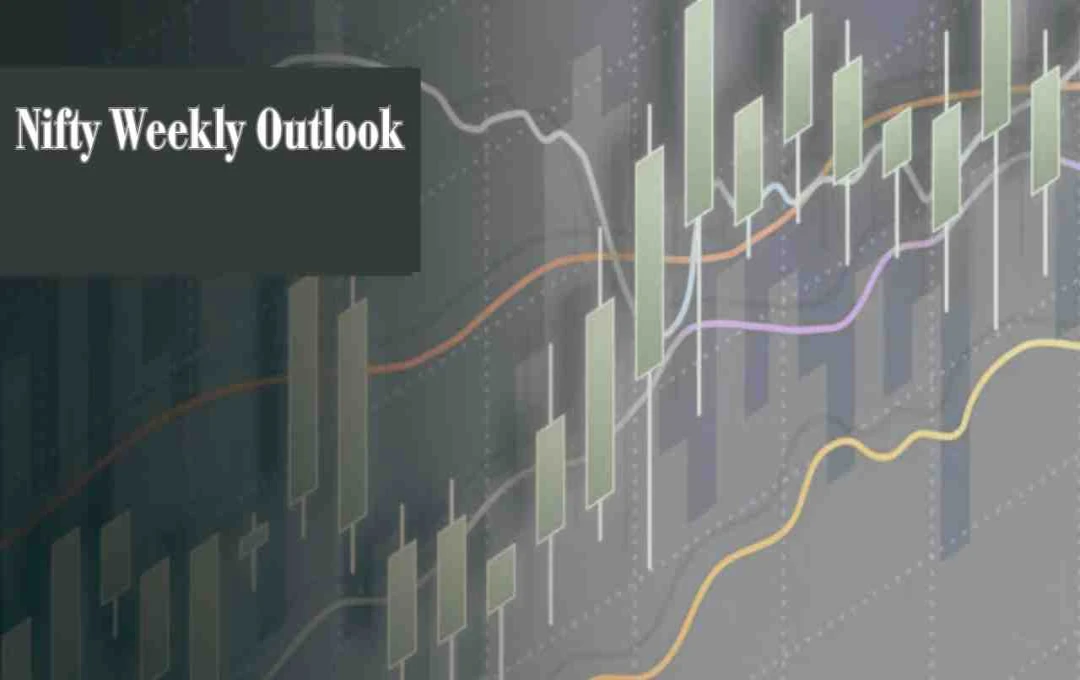
Nifty 50 closed this week at 22,397 with a decline. Strong support at 22,150 and breakout indication at 22,680. Investors are advised to exercise caution and employ risk management.
Stock Market: The domestic stock market witnessed a bearish trend last week (March 10-14). Nifty 50 and Sensex closed in the red for the fifth consecutive day due to heavy selling in the realty, IT, and auto sectors. The impact of President Trump's trade war on the US economy negatively affected major IT stocks.
Sensex and Nifty Performance
The BSE Sensex closed at 73,828.91 on Friday, down 200.85 points (0.27%). 22 stocks closed lower and 8 closed higher. The NSE Nifty closed at 22,397.20, down 73.30 points (0.33%). For the week, Nifty 50 declined by 0.69% and Sensex by 0.68%.
In the broader market, the mid-cap index fell by 2.2% and the small-cap index by 3.9%. Consequently, the total market capitalization of BSE-listed companies decreased by ₹1,71,623 crore to ₹3,91,12,994 crore.
Support and Resistance Levels for Nifty


Support Levels:
- The 22,150 level shows b support.
- The 22,000 level will be the next significant support.
- If the Nifty falls below these levels, the likelihood of further decline increases.
Resistance Levels:

- Nifty may face b resistance at 22,680.
- If this level is crossed, the index could reach 23,050 and 23,150.
- A major resistance zone will be formed between 22,700 and 23,000.
What does the Nifty chart show?
According to Choice Broking, Nifty 50 closed at 22,397 with a decline. This forms a Doji candle pattern on the weekly chart, indicating uncertainty. However, it also shows bullish signals due to support from the 100 Exponential Moving Average (EMA).
What should be the investor strategy?
Market Volatility Reduced, but Caution is Necessary
India VIX declined by 3.01%, reaching 13.28. This indicates reduced market volatility and increasing investor confidence. However, weak global signals and selling by Foreign Institutional Investors (FIIs) are still affecting market sentiment.
What are the indications from Open Interest (OI)?
According to Open Interest data:
- The highest Call OI is at 22,500 and 22,600, indicating b resistance.
- The highest support level is visible at 22,300.
- If Nifty sustains above 22,680, a new bullish trend is possible.
- If it goes below 22,150, further decline can be expected.