
The stock market opened on a slightly subdued note on Tuesday. The Nifty index opened near 24,730, but selling pressure emerged in the first hour, pulling it down to 24,600. Subsequently, the market traded within a limited range throughout the day. Overall, the Nifty showed a movement of only 60 to 70 points, indicating that the market is currently searching for a firm direction.
Chandan Taparia, Head of Derivatives and Technical Research at Motilal Oswal Financial Services, stated that the market is currently experiencing an environment of uncertainty. However, he also mentioned that some select stocks have shown signs of a b breakout and may see an upward movement in the coming days.
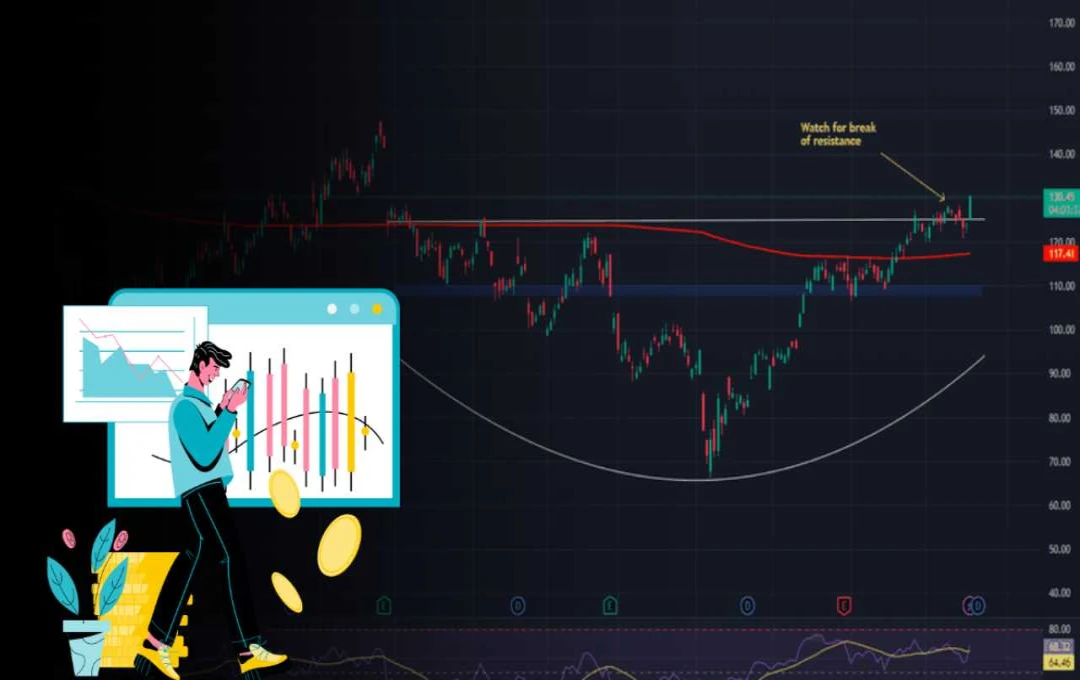
What are the important levels for Nifty?
According to Chandan Taparia, the Nifty is currently hovering near its 100-day EMA (Exponential Moving Average). If this level is breached, the market could see further weakness. On the other hand, if the Nifty holds above 24,600, it could rally towards 24,800 and 24,900. On the downside, 24,550 and 24,442 are key support levels.
What does the Option Data indicate?


As per the option data, the market has a higher call open interest at the 24,700 and 25,000 strikes. Conversely, put open interest is higher at the 24,600 and 24,500 strikes. This suggests that the market is likely to remain within a range of 24,400 to 24,900 for the time being, while its longer-term range is likely to be between 24,200 and 25,200.
Bank Nifty weakness persists
Looking at the banking sector, the Bank Nifty also had a weak start. It gradually slipped to 55,200. A small bearish candle has formed on the daily chart, indicating that selling pressure persists at higher levels. The Bank Nifty has fallen by approximately 1,000 points in the last few trading sessions.
The 55,555 level remains crucial for Bank Nifty. As long as it remains below this level, weakness may persist. On the downside, 55,000 and 54,750 are considered its support levels, while 55,555 and 55,750 have become b resistance levels on the upside.
Now, let's look at the 3 b stocks that are showing signs of a breakout.
TVS Motor - Bullishness seen on the chart
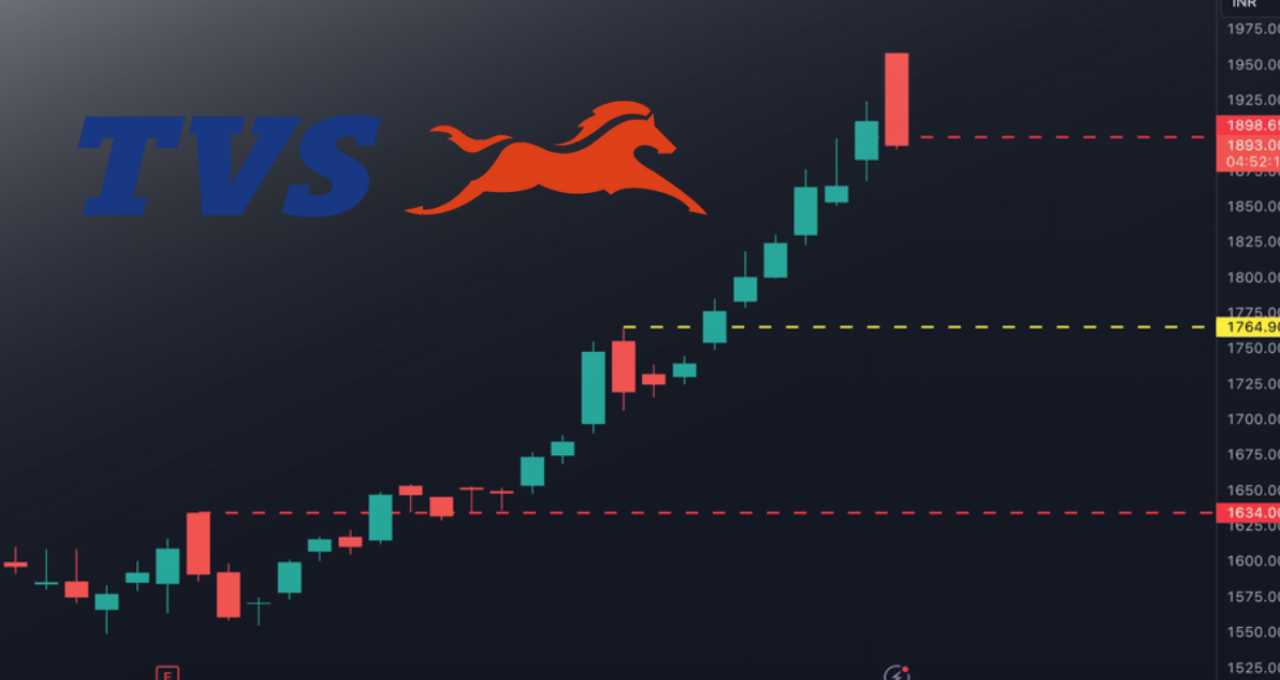
TVS Motor's current market price is ₹2,983. The company's shares have formed a b bullish candle on the daily chart. Also, a breakout has been observed from the consolidation zone. The trading volume has also been high, and the MACD indicator has given a positive crossover, which indicates further bullishness.
- Current Price: ₹2,983
- Target: ₹3,185
- Stop Loss: ₹2,875
SBI Life - Enthusiasm seen in the Insurance Sector
SBI Life's share has also shown a range breakout on the daily chart. Good buying is currently being seen in the insurance sector. The RSI indicator is also in the positive zone, which suggests the possibility of a rise in the share price.
- Current Price: ₹1,857
- Target: ₹1,965
- Stop Loss: ₹1,795
Jindal Steel - Uptrend consistently maintained
Jindal Steel's shares are currently in an uptrend. Buying is being seen on every dip. The stock is taking support from its 50-day moving average. The ADX indicator is also indicating that the trend remains b.
- Current Price: ₹1,000
- Target: ₹1,050
- Stop Loss: ₹977
Investors Uncertain about Market Direction
The stock market is currently not showing clarity in any one direction. While weakness persists in the Nifty and Bank Nifty, some sectors or select stocks are showing signs of a breakout. In particular, buying is being seen in some shares related to the insurance, auto, and metal sectors. This means that investors are not completely out of the market, but are looking for safe and technically b stocks.
Data related to derivatives indicates that the market is confined to a limited range. Put and call writing positions show that 24,600 is a key support, while resistance is at 24,700 and 25,000 levels. This suggests a range-bound trading scenario for the market.