
The first phase of the Bihar Assembly Elections 2025 has proven to be historic. On Thursday, November 6, 64.66 percent of voters exercised their franchise across 121 seats in 18 districts.
Patna: The first phase of voting for the Bihar Assembly Elections 2025 has concluded, and this time, the enthusiasm for voting in the state appeared to be at its peak. According to Election Commission data, a record 64.66 percent voter turnout was recorded in the first phase — which is approximately 8.5 percent higher than the previous assembly election.
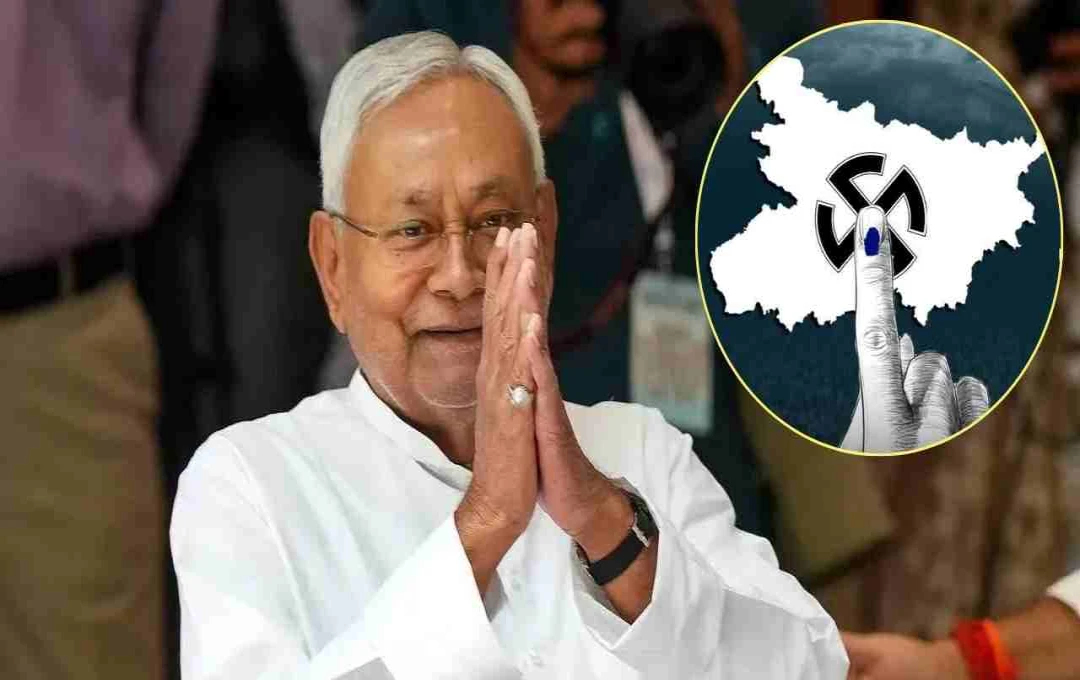
While this increased voter turnout is a positive sign for democracy, this figure could become a political headache for Chief Minister Nitish Kumar (Nitish Kumar) and his party. The reason is that, in Bihar's history, every significant increase in voting percentage has been followed by a change in government.
Record-Breaking Turnout, But a Cause for Concern for Nitish
On Thursday, November 6, voting took place on 121 assembly constituencies across 18 districts. Last time, in 2020, the first phase saw 56.1% voting on 71 seats, whereas this time, the figure surged to 64.66%. According to experts, a high voter turnout usually indicates public dissatisfaction or a desire for change. In this context, this trend could be a cause for concern for the alliance led by Nitish Kumar (JD(U)-BJP or the prospective NDA).
Whenever Voting Increased, Government Changed
Looking at Bihar's political history, there have been several instances where increased voter turnout signaled a change in government.
- 1962 vs 1967: In 1962, Bihar recorded a 44.5% voter turnout, which increased to 51.5% in 1967. Following an increase of approximately 7%, the Congress government lost power, and a non-Congress government was formed for the first time in the state.
- 1977 vs 1980: The 1977 elections saw a 50.5% voter turnout, while in 1980, this figure reached 57.3% — an increase of approximately 6.8%. Result: The Janata Party lost, and Congress returned to power.
- Other Examples: In the 2005, 2010, and 2015 elections, significant shifts in political equations were observed when the voting percentage increased.
Voter Turnout in Bihar Over the Years
|
Year |
Voter Turnout |
Political Outcome |
|
1951-52 Read Also:-
|
42.6% |
Congress victory |
|
1957 |
43.24% |
Congress in power |
|
1962 |
44.47% |
Congress returns |
|
1967 |
51.51% |
Congress lost, non-Congress government formed |
|
1969 |
52.79% |
Political instability |
|
1972 |
52.79% |
Congress returns |
|
1977 |
50.5% |
Janata Party in power |
|
1980 |
57.3% |
Congress returns |
|
2010 |
52.73% |
Nitish Kumar's victory |
|
2015 |
56.91% |
Mahagathbandhan in power |
|
2020 |
57.29% |
NDA government |
|
2025 (First Phase) |
64.66% |
Results awaited |

Political analysts believe that increased voter turnout in Bihar often signals an "Anti-Incumbency Wave." This means that the public desires change and turns out in large numbers to cast their votes. However, some experts also believe that increased voter awareness and youth participation are significant reasons for the higher polling percentage this time. The female voter turnout has also been higher compared to previous elections, making the political equations even more interesting.